Entering the second annual NogFest, one player in particular was flying under the radar. After famously squandering a 15-2 lead, then following that performance with an unsurprising yet still demoralizing defeat in the Brother Pi semifinal – to the same team, no less – some questioned whether he or his partner could ever come back, mentally. When they dared not show their faces at the inaugural post-grad tournament, the doubters felt vindicated, and his entry into the second year’s lists – with his old teammate still hiding in shame – went without much fanfare.
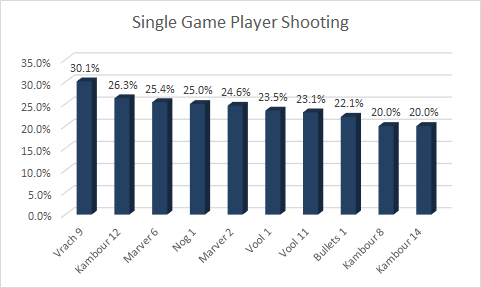
After the events of that day, and his scathing, incendiary 30.1% shooting percentage across his entire third game, it was clear to all he was back like 45. Yet it was actually during his first match when he announced to all naysayers his triumphant return. Facing game-point, 63 minutes in and 7 points deep into overtime, he shrugged off the battering of cups and the shrieking of his partner, stood his ground like Gandalf in Moria, and manifested to a higher plane:
The look on Vrach’s face when that ball goes in. THAT’s why pong is the best. Welcome back, everybody, to the greatest drinking sport there ever was or will be.
NOGFEST: CHAPTER II
In case you missed, or would like to brush up on, the rules of the game and the analysis I’ve previously published, check out the posts below:
DKE Pong Rules & Regulations
The Brother Pi Breakdown
Pong II: Advanced Analytics
Don’t Doobie
NogFest 2015 Analysis: Player Performance
NogFest 2015 Analysis: Individual Games
Otherwise, before we jump in, I’d be remiss to not disclaim that all data has been entered manually, and thus is not error-free. For instance, there are more sinks logged than there are rebuttals attempted, despite us actually making a few of them. Capturing this information required watching not-always-clear videos and typing numbers by hand into dozens of interconnected formulas across multiple spreadsheets. If I screwed something up, apologies – I did my best to be accurate and fair.
Besides, it’s not like any of us are perfect at tracking any of this, to the point that we frequently screw up the score during the games themselves. I mentioned this general dynamic in a Blogcat last year; here are some of the specific mistakes we made this time around:
- Game 1: With the match tied at 17-17, the teams literally checked the video replay to make sure they had the score correct. They decided it must be 18-17. The game in truth ended at 20-19, which means there’s a chance that, if it had been scored correctly, Nog & RJL lose that first game and get knocked out in the group stages.
- Game 6: The players skipped from 5-5 to 7-5. Lambie also took a third service rotation.
- Game 7: Spieler served one time too many, taking 6 in a row. He used that last serve to argue the score from 8-13 down to 8-12, in his favor.
- Game 11: Spieler took 3 service rotations, serving 14 times. Such a serve hog.
Next year we’ll strive to use a whiteboard and scorekeepers, but regardless, this is our canon.
Offense
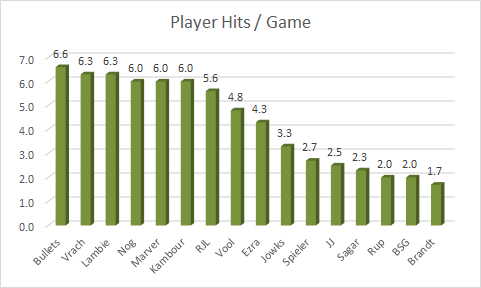
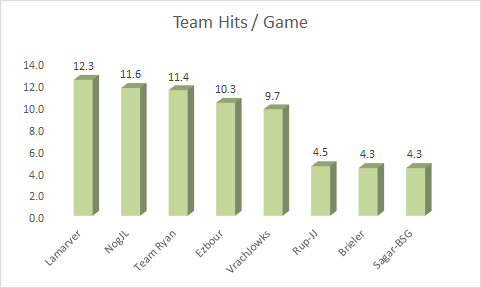
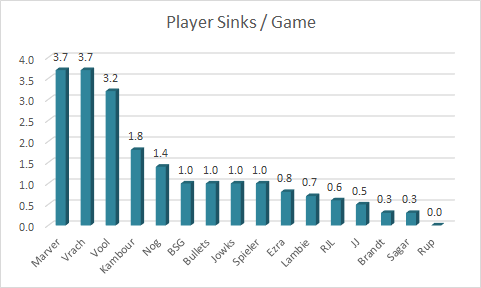
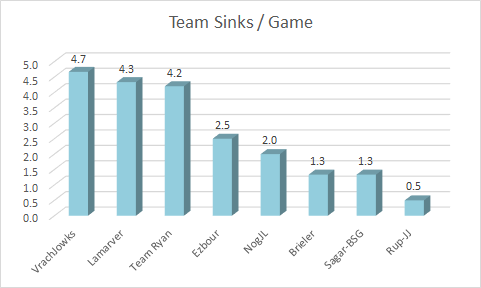
Let’s start by breezing through our old friends and basic box-score stalwarts:
First with Hits:
Then Sinks:
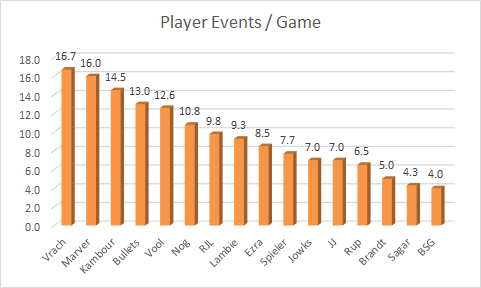
Then, and more importantly, Events (Hits + Saved Hits + Sinks) as a whole:
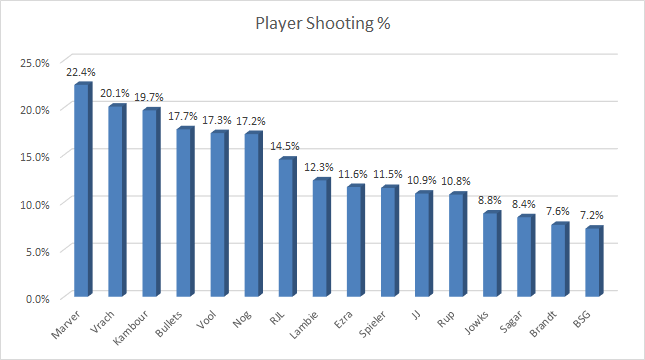
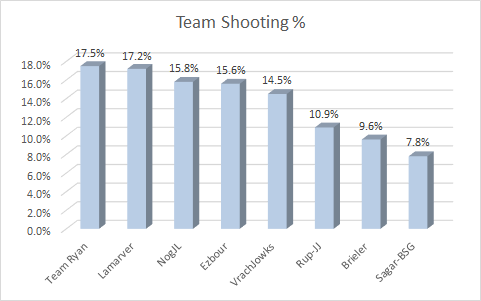
Next, let’s get to a more recent yet still fairly straightforward stat – Shooting %:
Shooting efficiency is a great barometer of offensive effectiveness, but it’s really not the ultimate measure of a player’s ability to impact a game offensively. This is because, I would argue, some players have shot trajectories that are more/less difficult to save, and thus the cups they hit are just more/less valuable. The same applies to sinking, too – some players are more sink-happy than others. So really, what we need to do is not only factor in Shooting %, but also the concepts of Hit Rate (Hits/Cups) and Sink Rate (Sinks/Events)
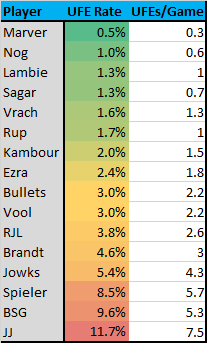
This is important because, at its core, scoring points is what matters, so regardless of how often you’re hitting, if you’re not scoring then you’re not all that impactful for your team. That, of course, would still be better than giving the other team points by hitting it off the table – something else we need to factor in, too:
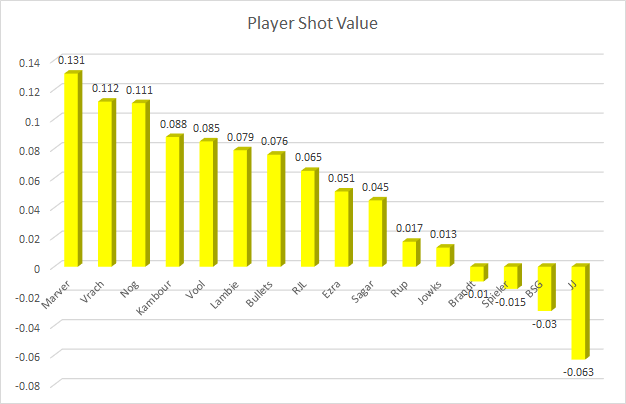
The bottom line is we should be looking beyond just accuracy, instead comparing how often a shot results in a point scored with how often a shot scores for the other team by going off the table. To do that, let’s now consider Shot Value:
Shot Value = (Points Scored – UFEs) / Shot
Shooting % and Shot Value are going to be closely related, but the latter is still, at a large sample size, a purer description of a player’s value on the offensive end.
There are, of course, two sides to the table though.
Defense
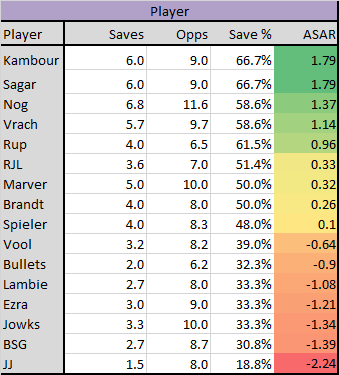
Saving seems as good of a topic to start with as any, so let’s take a look at save averages, save opps, save efficiency, and Average Saves Above Replacement (on a per game basis, how many more saves did a player make than the average defender, who saves at 49.4% rate, would have made on the same number of opportunities):
Next, one facet I’ve never touched on is the rebuttal game. Throw-backs are not hugely influential to winning, given their rarity and that they don’t (directly) affect the score, but worth investigating nonetheless:
A concept I created last year was the Flat Hat Club, an exclusive membership for those who have managed to play an entire game without surrendering a hit or gifting a UFE – the pong equivalent of a Perfect Game, in that the player individually did not yield a point to the opposition. Last year, both Ezra and Sagar became the club’s charter members, posting Flat Hat 1’s (i.e., they each went 1-for-1 in saves), but I predicted those performances would eventually get bested. Well, in a new twist on the term “self-fulfilling” prophecy, yours truly was happy to deliver, logging a Flat Hat 5.
This concept inspired me to start looking at Points Lost – how many points did a player surrender in a given game:
Points Lost = Missed Save Opps + UFEs
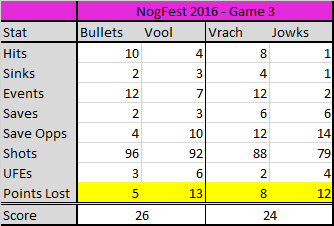
While a bit crude, a lot of times this new stat fairly-accurately tells the story of where in the wall those points got through. For instance, take a look at the box score below:
Points Lost helps magnify that in this particular game, most of Majowka & Vrach’s scoring was coming against Vool. However, looked at another way, the raw totals are not entirely fair to consider. After all, Vool should have lost more points than Bullets, by virtue of facing more save opps, so it’s a bit misleading.
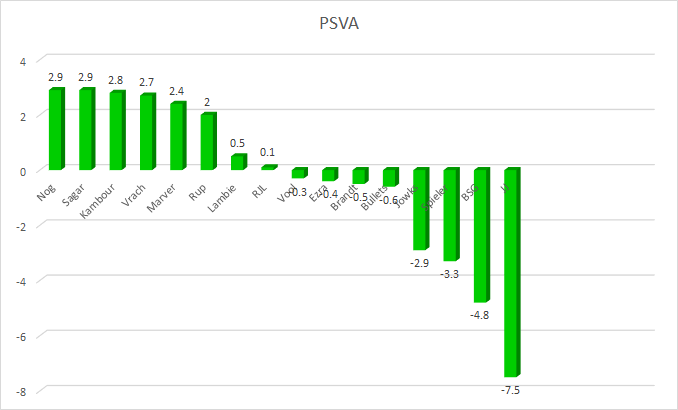
Creating this stat did contribute, though, toward developing a metric that more accurately measures how hard it is or was to score on a player. I got to thinking, “if that’s how many points you did lose, then how many would the average player have lost, and then how do those numbers compare?” To get there, I developed a new stat I’m calling “Points Saved vs. Average,” or PSVA:
PSVA = (Save Opps x Avg. Save Rate) + (Shots x Avg. UFE Rate) – Points Lost
Here’s how those numbers bore out this year on a per-game basis:
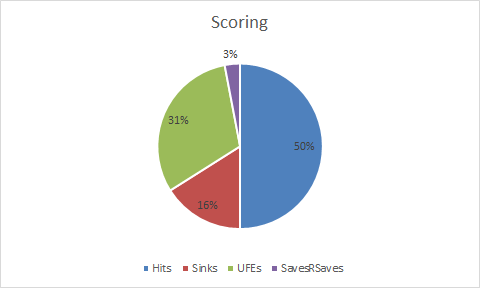
In fact, speaking of yielding points, how do most points get scored? By combining data from this and last year’s games, you get the following breakdown:
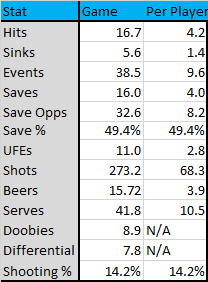
Now that I’m thinking about it, what does your average game look like?
Overall
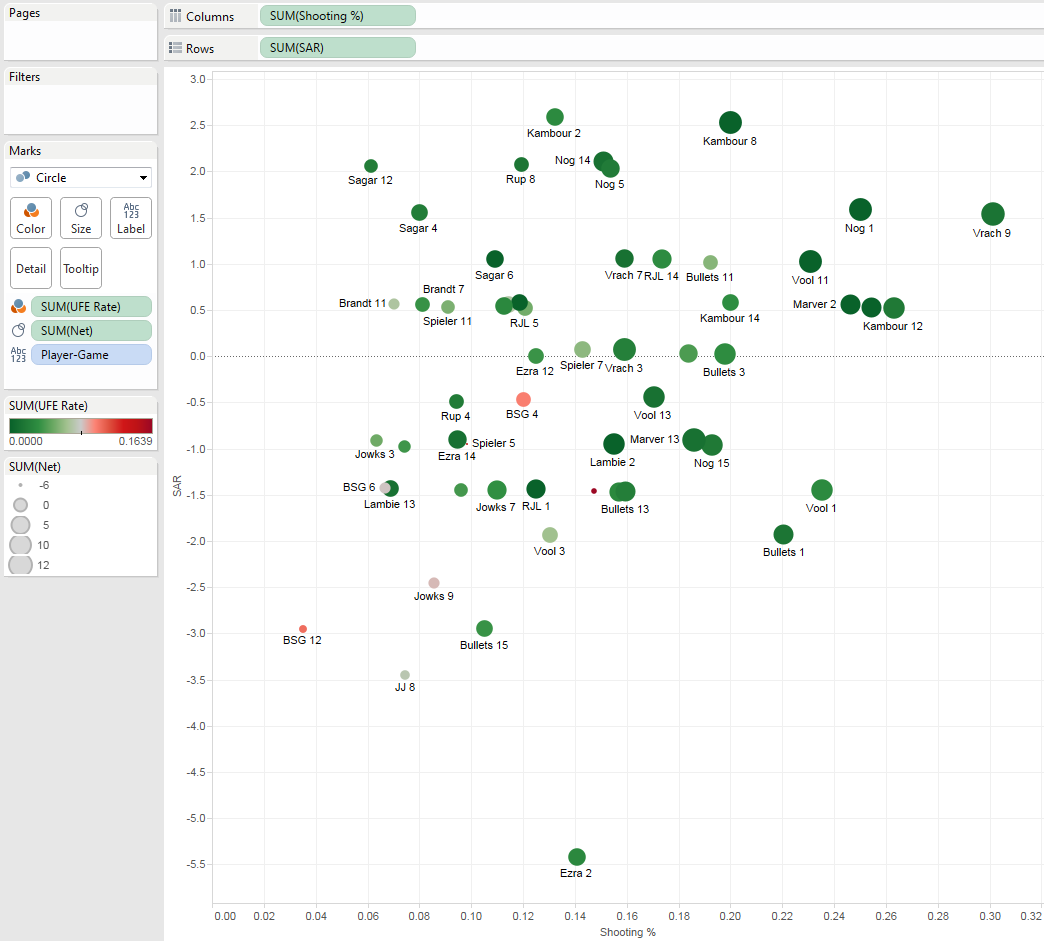
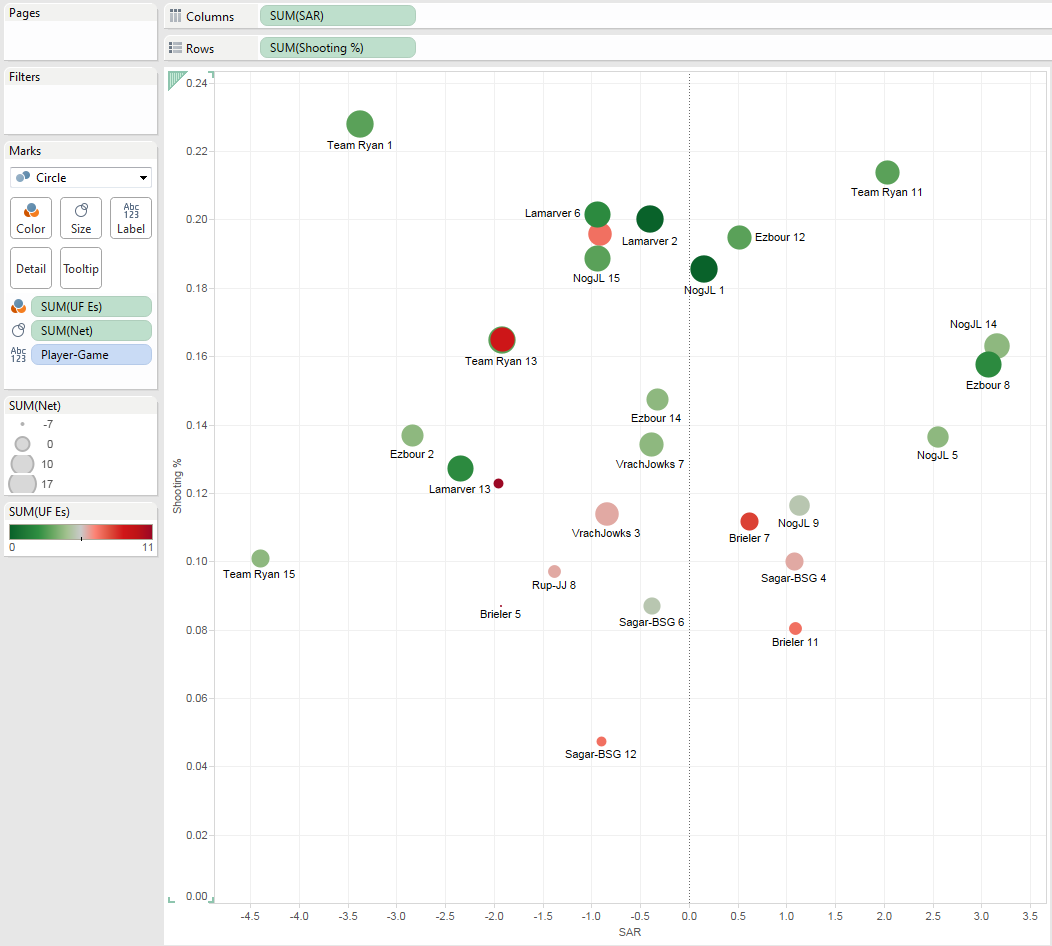
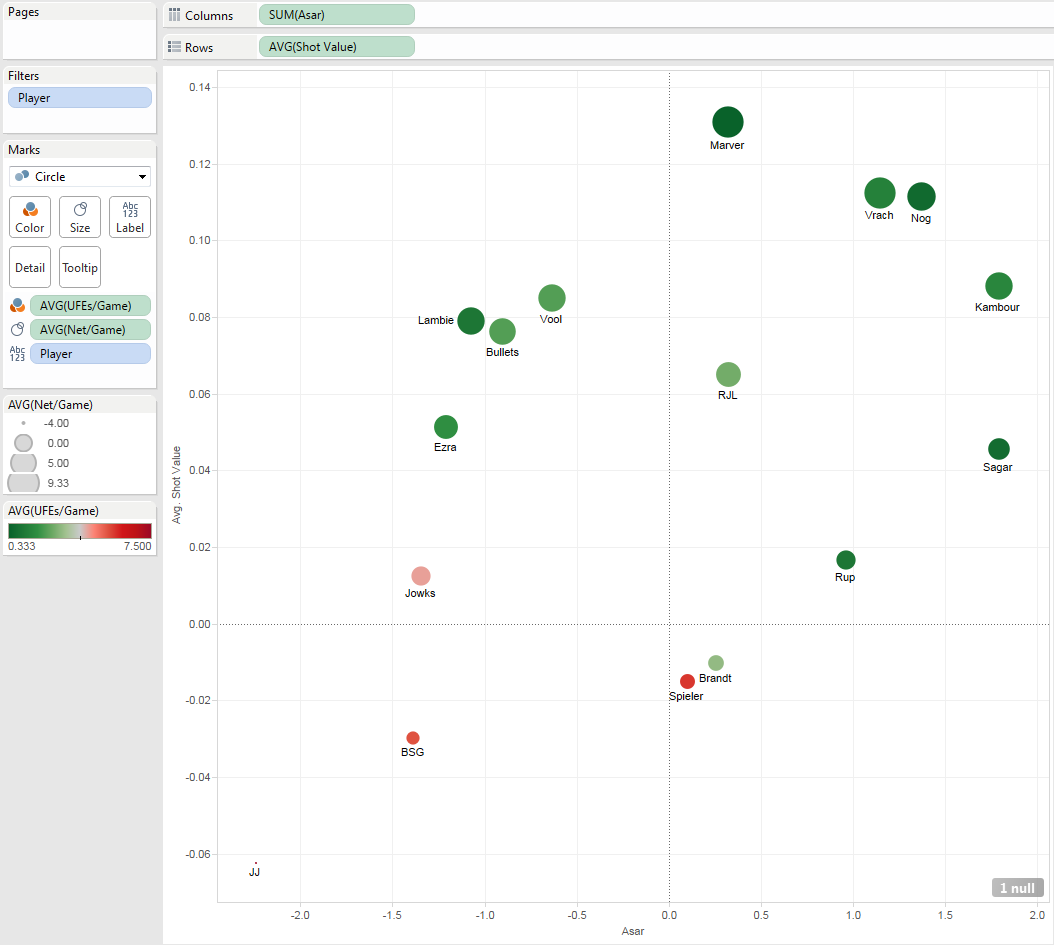
Blending offense and defense gets you overall performance (no special teams?!), so we now turn our eyes there. How did individuals play overall? Which team had the best game? We’ll combine Shooting % (Shot Value is too volatile on this small scale), ASAR, UFEs/Game and Avg. Net Rating (Points Won – UFEs) to analyze:
<Click each scatter-plot to expand for a better look>
Best Game by a Player:
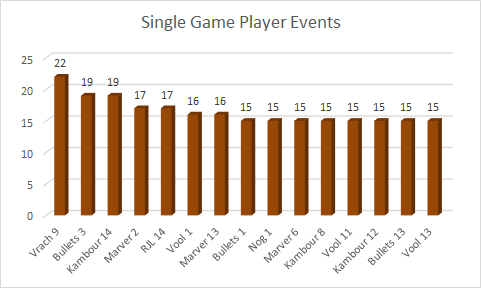
This one seems to clearly go to Vrach 9, which propelled him & Jowks to victory over Nog & RJL. His 30.1% shooting percentage is better than any figure we’ve tracked in that statistic by a wide margin. Combine that with his 5 sinks, tournament-leading 22 Events, and 1.5 SAR to just 1 UFE… nicely done.
Best Game by Team:
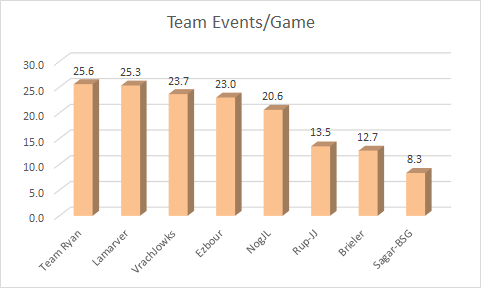
Bullets & Vool’s final group-stage game (Team Ryan 11) against Brandt & Spieler really lays the smack-down here. Elite saving, elite shooting, solid UFE rate.
And now, Best Overall Player:
Despite Nog & RJL repeating as champions, I think it’s pretty clear Marver wins this year’s MVP. You could probably make a case for Vrach, too, but I mean, look at where Marver ranked in our major per-game stats:
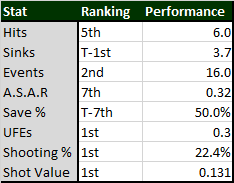
Finishing first in Shooting %, Shot Value, UFEs, and Sinks, and second in Events, while also being above-average defensively is damn impressive.
More Data & All-Time Performance
What is nice about playing multiple tournaments – because Nog winning both is not – is that our results are more statistically significant and informative. Compiling more data allows us to build Pythagorean Win Expectancy equations, like Bullets is going to attempt, or to run regressions to weight variables that can combine to model ability level – basically, someone’s overall Madden or 2K rating. After all, we can already trust Save % as a better indication of talent than we could with just 2-3 games logged.
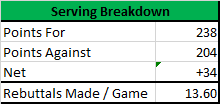
We can also revisit last year’s piece which proposed the controversial idea that Serving, contrary to historical belief, might be a disadvantage for your team. On average in 2015, teams were in the net negative when they served, with the theoretical explanation being that, since Serve Points and Serve UFEs were equal and cancelled each other out, you were basically allowing the returning team to start with the first shot.
This year, however, the numbers point back in a more intuitive direction:
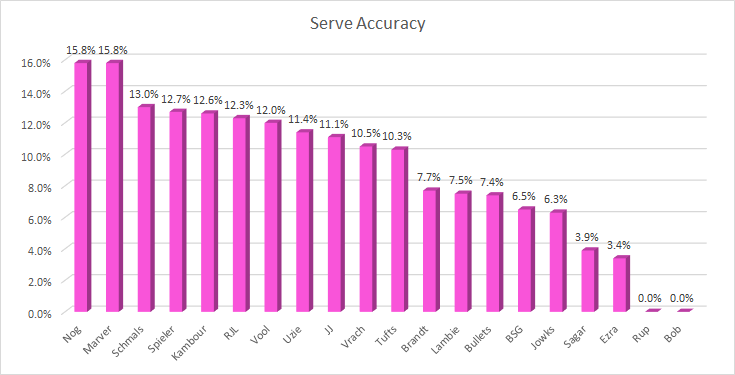
Maybe we had been right all along. Or, perhaps, better servers happened to take more serves this time around, and teams really should take into account whether that player is good at serving when they are deciding to doobie or not. Nog, for instance, definitely wants more serves:
It’s also cool to check out how last year’s tourney compared to this year’s in more than just serving:
Aside from saving slipping a bit, the quality of play was much better in basically every category. We shot better, sank more, hit it off the table less, and played far more competitive games. Pretty sweet.
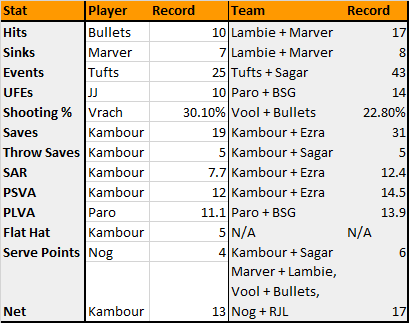
One other thing I’m extremely excited about is our ability to track all-time records. Now, the elephant in the room with these high-water marks is that we played hundreds of games over the years that were never chronicled. Legends about Johnston sinking 10 in a game are sadly not represented here, lost to oral history. Alas. With respect for the fallen, here are the crowning achievements in each major category we’ll be striving to beat moving forward:
Unanswered Questions
These new data have already aided our understanding of the game. We have a clearer picture of averages, who is good or bad at which skills, and to what extent. There are, of course, still many questions out there I’d love to explore further; these are some of those topics that I keep coming back to:
- Partner Influence: In what ways does the performance of your teammate affect your performance? If your partner is hitting a lot, does that lower your own shooting %? If you partner is saving a lot, what does that mean for you?
- Opponent Influence: Same idea, but on the other side. I think the most obvious one is to look at how your opponent’s shooting % affects yours. After all, if your opponent is hitting frequently, you are probably bracing for a potential save opportunity instead of trying to square up for a return volley. Similarly, are some players more returnable than others? Lambie and Spieler shot 12.3 and 12.4%, respectively – a negligible difference in a vacuum – but would I rather be returning against one or the other?
- Teammate Variations: Could their opponents be why Nog has faced 10.4 save opps/game compared to RJL’s 6.2 – a 4.2, or 68%, difference? Or is that just a weird quirk across 9 games, and over time that trend would go away? Or is it both, or something else?
- Skill Value & Player Ratings: To what degree do different abilities – especially the big 3 of saving, shooting, and keeping it on the table – influence your win expectancy. Then, can we use that weighting to give a definitive answer to how players stack up against each other? This would help inform debates like, for instance, who is the better player:
- Vool: 15.9% shooting, 4.1% UFE, 32.5% save
- Tufts: 14.4% shooting, 4.9% UFE, 73.1% save
- Sinking Value: Zeta Psi’s pong rules count a sink as being worth 2 points, and yet a sink in DKE is still more valuable than a hit, despite both counting for the same 1 point. Even if we just compare Sinks vs. Hits (as opposed to Cups-Hit that could potentially be saved), I think we’d all agree that the former are still worth more. Sinks intoxicate your opponent to a greater extent, and potentially make them feel bloated and/or unfocused. But how do you quantify that? And how do you factor in the previous sinks (sink #5 is more devastating than sink #1), as well as the cadence of those sinks (triple back-to-back vs. 3 across the course of the game)?
Maybe we’ll tackle those, or any of the 395 other questions I have, next time around. Until then.

